Apple’s Safari web browser was upgraded to version 4 yesterday and with it came an update to the developers tools first introduced in Safari 3.1. The new version is set to give Firefox’s FireBug plugin some very serious competition. Not only does the Development environment look and perform very well, it’s also very full featured.
In the toolset we find inspection of HTML and CSS, JavaScript debugging, page load profiling tools and a Databases inspection tool presumably for HTML 5’s offline storage support. There are also tools to disable caching, spoof user agents and more from the handy Develop menu.
Inspecting Pages
When designing a new web page frequently plenty of time is spent making minor changes, updating the server and then checking the results in the web browser. This three stage process slows down the design process and hampers the creative flow. Page inspection tools allow you to review and edit your page live in the browser, allowing you to easily try out different CSS rules or HTML edits until you know what you want. And what you see is literally what you get – your preview is the actual web browser.
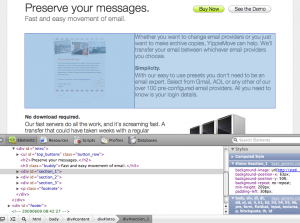
Safari 4’s “Web Inspector”, shown with Develop / Show Web Inspector, is Apple’s take on page inspection. Reminiscent of Firebug’s equivalent, the inspector area attaches to the bottom of the Safari window. On the left hand you get the HTML for the page and on the right hand you get the full hierarchy of CSS affecting the currently selected element. By choosing the magnifier icon you can click on any element in the page – a headline, an image, a paragraph – and bring it into focus in the HTML view. The same can be done by selecting tags in the HTML source code directly.
When an element is selected it is outlined in blue in the page. A light blue box shows the dimensions of the element itself and a darker blue box behind it outlines the element with margins included. This is helpful when an element is not positioned where you want it or it’s the wrong size. The blue boxes will let you know if the problem is with the margins or if there is something else going on.
Once you have a theory of what you’d like to change you can go in and edit the effective CSS directly using the Styles panel on the right hand side. For instance you could tweak the font-size by double clicking the font-size value and typing in a new number. A set of checkboxes also allow you to toggle individual CSS rules on or off to see how that affects the page as a whole. A great tool for hunting down what CSS rule is doing what. For each section in the Styles panel you also get the responsible selector and the CSS file it comes from, making it easy to copy your changes back to the original style sheet when you are done with your edits.
The CSS editor is well designed but it does not seem to allow adding new CSS rules live, a feature available in FireBug.
What’s Taking so Long?
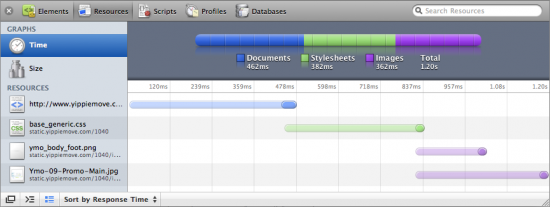
Another important consideration when designing a website is the page load time. Safari 4 boosts a slick looking Resources inspector which gives the developer a breakdown not only of how long each JavaScript, CSS or image file took to load but also when each download started. All of this is shown in the context of the whole page load from the first millisecond to the last.
By laying the load time out in a timeline various sources of delay can be tracked. For example in the screenshot above the main document takes just short of half a second to load. We can also see that the CSS file request goes out even before the main HTML is finished loading, as Safari finds the CSS link in the header almost immediately. For each bar the semitransparent section is the latency – the time until the first byte of the response. So in the above case we can see that the latency makes up the majority of the load time. We can also see that the two images used on the page are loaded concurrently and that they start loading immediately when the CSS has been retrieved. Finally the colorful bar on top breaks the total load time down by type and lets us know the whole page finished loading in 1.2 seconds.
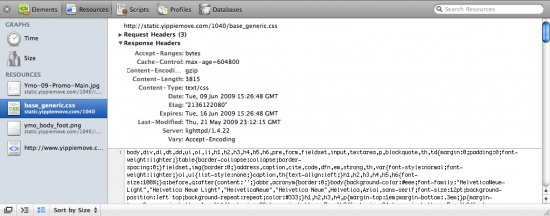
Individual resources can be inspected, allowing the developer to review the size and contents of each resource. In the same section the request and response headers can be reviewed. This is useful for the web server administrator in order to determine compression status and cache expiration headers. Strangely enough POST parameters don’t seem to show up which could be a serious problem for debugging.
Breaking Into the Source
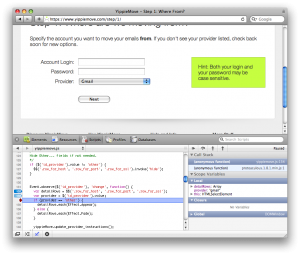
In the web 2.0 age, JavaScript is almost as important as the HTML and CSS that make up a page. Luckily Safari 4’s JavaScript debugging facilities give you a window into your code as it runs. You can set breakpoints, step through source code and inspect the call stack and variables as you go along.
When a page has been loaded the Scripts tab shows the various JavaScript resources available on the page, by source filename. When a file has been selected the JavaScript is displayed with syntax highlighting and line numbers. Clicking on a source line number sets a breakpoint. Once the targeted code executes Safari automatically launches into single step mode, allowing for the usual controls: Step Over, Step Into and return (called Step Out). At each step you can also inspect the values of the variables available in the scope.
There is also a Console feature which not only shows console messages and errors generated by your JavaScript during runtime but allows you to run commands live. Need to see what happens if a certain variable has a different value? Just set it using the console and watch the results unfold in the active web page.
Step Behind the Scenes
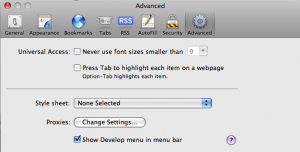
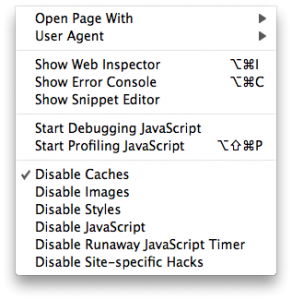
Safari 4’s Develop menu reveals additional tools and utilities useful for debugging and inspecting a web page. Enable or disable caches, images, CSS or JavaScript to see what the page looks like in a degraded state. This allows you to make sure the web page looks good even without images for instance, a great utility for making sure your website is accessible for persons with disabilities. Toggling JavaScript is also an obvious boon when you need to make sure your software runs in text browsers or where JavaScript has been disabled for security or performance reasons. There is also a “Snippet Editor” which seems to allow easy previewing of HTML snippets.
There are some flaws. Two were mentioned above: there does not seem to be a way to inspect POST data, important especially when debugging AJAX, and it does not seem possible to add new CSS rules dynamically as you could in FireBug.
There is also a selection bug: when the Web Inspector is revealed, selecting any text on the page causes the window to immediately scroll to the bottom. This subsequently selects all text on the page below where you started to select. Another bug is that if an element is selected such that the blue outline boxes show up, switching tabs sometimes left the outline hanging around in the other tabs too, now not highlighting anything in particular. Finally the JavaScript debugger seems to freeze up JavaScript in every Safari page – not just the one you are working with. This makes it hard to work with say an online reference in a different window.
A more minor flaw is a missing feature. There is no page optimization analysis tool such as Yahoo’s YSlow or Google’s Page Speed. These tools help analyze pages for performance problems. For example they check for additional compressibility in images and for correct headers.
These flaws aside the Development tools found in Safari leave little to be desired. All the features you expect are there and the package is polished far beyond what’s ordinary for web development. Apple has clearly been looking to FireBug when picking their features and that’s a good thing. FireBug has for a long time been setting the standard for these kinds of tools, but has been suffering from engineers’ syndrome: heaps of features but with little mind to UI design and detail polish. Safari 4’s development environment meets nearly all the same requirements and does it in style, bringing an excellent choice to the web developer’s toolbox.
Read more about the new developer tools at Apple’s What’s New page.
Author: Alexander Ljungberg Tags: Apple, CSS, development, FireBug, FireFox, HTML, JavaScript, Mac OS X, performance, review, Safari, web


Nice review. I discovered Safari’s inspector recently and I was surprised to see how rich it is.
I usualy develop on Firefox using FireBug, and there is still 2 things missing on safari:
– you can not add css selectors and css properties in safari’s inspector, you can just modify existing ones.
– you can not see Post and Get parameters sent to outgoing request which is very very usefull for ajax debuging.
Those 2 things are really missing in Safari 4 … I don’t understand why they did not put those features in their so nice inspector. For me they are part of the things I need and use 100 times a day.
I’d really love to switch to Safari cause it’s so nice and fast :/
Did you find a solution about those 2 missing features ?
Yes, it does seem difficult to add new CSS rules. I tried what I usually do in FireBug which is to double click underneath an existing rule but no luck. My workaround so far has been to edit the HTML of the element instead and add a style=”…” attribute. This works so-so – sometimes when double clicking an element to edit it’s HTML I get a blank inspector view.
Regarding inspection of AJAX interaction and POST content, I hadn’t thought to look yet but you’re right. They don’t seem to be there. I have updated the post noting that. That’s a fairly serious shortcoming. Let me know if you find a workaround!
Actually, I’ve found a way to add new CSS rules, all you need to do is edit an existing one, and add a semicolon at the end and then add the new rule.
For instance, if you have
color: “white”
and change it to
color: “white”; background: “black”
once you unfocus a new line is added with that property set
Safari 4 is very helpful. I have been using Golive, this seems quite handy.
I really wanted to be able to switch to Safari 4 from FF3, but the inability to add new css via the inspector is a total deal-breaker. I absolutely have to have that functionality.
Also, what’s up with the inspector not showing line numbers in the css?
Okay, so there IS a way to add css. Double-click on the attribute, then add your new css after the semi-colon.
Still, no line numbering as far as I can tell.
Great catch about adding CSS rules. Thanks.