Once in a while it happens. You know what I’m talking about, that ‘wow’-experience when you try out some new software.
This happened to us a couple of weeks ago. We were looking for a way to keep track of the server utilization. We needed to find out the usage during peak hours, to determine if it was time to upgrade to new hardware or buy another server soon or not.
After a bunch of hours googling and searching the Gentoo forum (guys, we’re still friends, right?), I found a thread that discussed this exact problem. After looking through a couple of the applications listed, I found it. The answer to all my problems was spelled Cacti.
Cacti is simply a web-based SNMP-client that uses RRDTool to generate nice graphs. Sounds quite simple, right? Why am I so impressed and excited? Because Cacti is really SNMP made easy.
I’ve been looking at similar solutions before, but everything I found felt very Beta / “Hack it to make it work on your system.” Cacti on the other hand was really easy to install and configure. It probably took me about 10 minutes to configure it for my needs, and then another 10 minutes to get a local SNMP daemon to run (even though this is not necessary).
Cacti requires the following:
– Apache (might work with other webservers)
– PHP
– RRDTool
– MySQL
– A crontab-job
After configuring the database-settings for Cacti, you just add a crontab to execute a given PHP-page (poller.php) on a given interval (5 minutes), and you’re set. Now you can start adding your other SNMP-enabled devices to your Cacti page.
 One of the demo-sites listed on Cacti.net
So let’s say you have this cool device that supports SNMP, but you don’t really feel like writing a custom template for the device. Well, just head over to the Cacti forum and search for the device. Chances are you’ll find that someone already wrote a template for the device. Take a look at the forum and you’ll find that people have written templates for all kinds of random stuff.
Things that we use Cacti to monitor:
– CPU usage
– Memory usage
– Network usage (both servers, routers and APs)
– Individual daemons (Apache, MySQL etc.)
– Laser printers (to monitor toner level)
– UPSes (with a plugin to get info from NUT)
Some of our graphs:
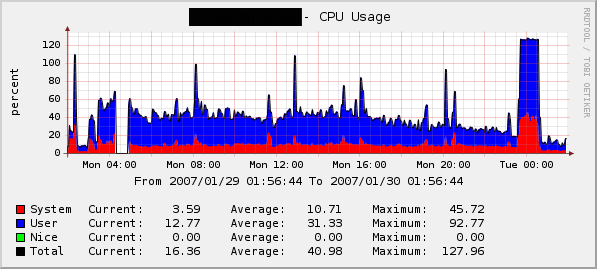
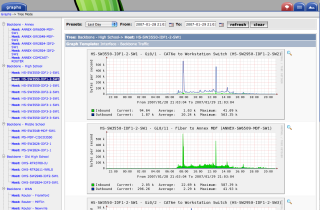
 CPU Usage when PlayingWithWire.com got Slashdotted
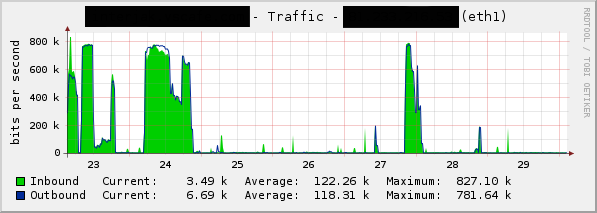
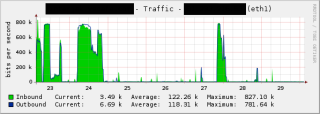 Bandwidth status on one of our routers
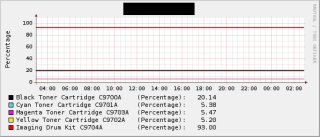 The status of my HP Color LaserJet
It’s very convenient to just browse into Cacti to get a quick overview of your network/server utilization. In addition to that you can also select what specific time-span (daily, weekly, monthly etc.) you want to see. I love it.
If those things listed aren’t enough, just head over to the additional script-page where you find tons of other script for other purposes. By default, Cacti comes with templates for the most common SNMP-setups.
So did we need to upgrade our server? Nope, as it turned out, we were doing fine.
By the way, due to security reasons you might want to disable the guest account in cacti.
Update 1: As the Cacti Developer Tony Roman points out, regardless if you use Cactid or not, you will still need a crontab job. The article previously stated that if you use cactid, you won’t need a crontab job, which was wrong.
Author: Viktor Petersson Tags: guide,
open source


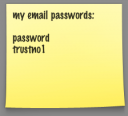 Chances are you will tire of that, and then you’d be back to writing your passwords on little post it notes. Or even worse: you’ll start choosing passwords that are easy to remember. This is one of the cardinal mistakes when trying to live securely. Memorized passwords are usually the worst passwords; simple, easy to guess and likely to be reused. How many people are reading your email right now because you choose your high school sweetheart’s name as your password?
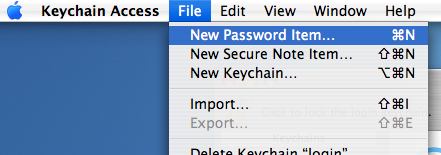
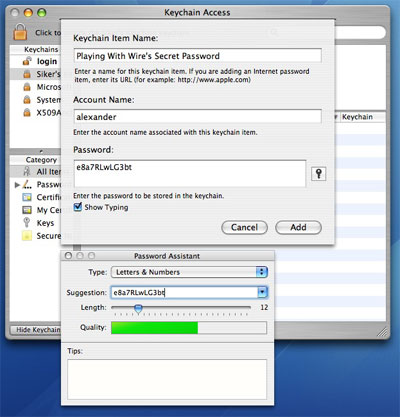
 Type in a password of your choice. You may click the key icon to the right of the Password field to open up Keychain’s built in password assistant.